Aug 11, 2026Technical Guides
In-Line Viscosity Measurement Technologies Compared
A conditional comparison of common in-line viscosity measurement approaches, including process behavior, installation, correlation and maintenance factors.
Direct answer
In-line viscosity technologies should be compared using the actual fluid, temperature, shear behavior, process connection, flow conditions, cleaning method and control objective. No single principle is best for every liquid or process. Laboratory and in-line values may differ because the measurement methods and conditions differ.
Define the property being controlled
Viscosity depends on temperature and, for non-Newtonian fluids, may also depend on shear rate and time history. Define whether the process requires dynamic or kinematic viscosity, an empirical correlation, a consistency index or a repeatable process indicator.
State the reference method and the conditions at which results will be compared. A numerical match is not meaningful unless units, temperature and method are aligned.
Common measurement approaches
Rotational methods
Rotational instruments infer viscosity from resistance to a rotating element. They can provide a controlled shear condition but may involve moving parts, seals and installation constraints. Suitability depends on the process and cleaning requirements.
Vibrational or torsional methods
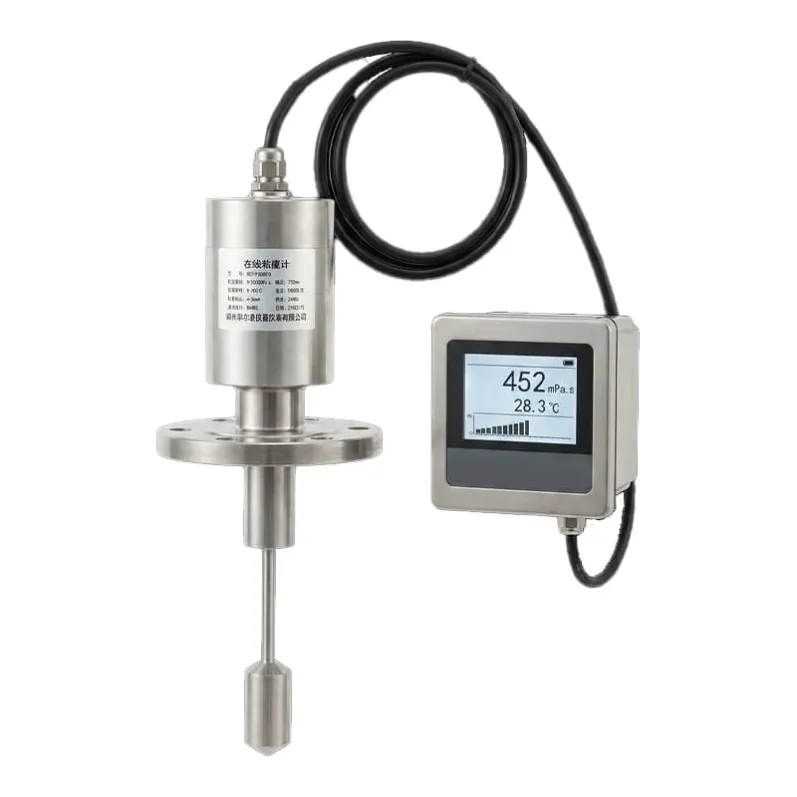
These instruments infer fluid behavior from changes in a vibrating sensing element. Designs vary, and the result may depend on density, temperature, mounting, flow and buildup. Verify the exact model’s method, output and correlation requirements.
Falling-body or piston-related methods
Some instruments infer viscosity from movement through or interaction with the fluid. They may be appropriate in particular ranges and process arrangements but can have different sensitivity to contamination, pressure, orientation and flow.
Indirect process correlation
Pressure drop, pump load, flow or other process measurements may be correlated with viscosity when the process and geometry are stable. Such correlations are application-specific and require validation.
Installation factors
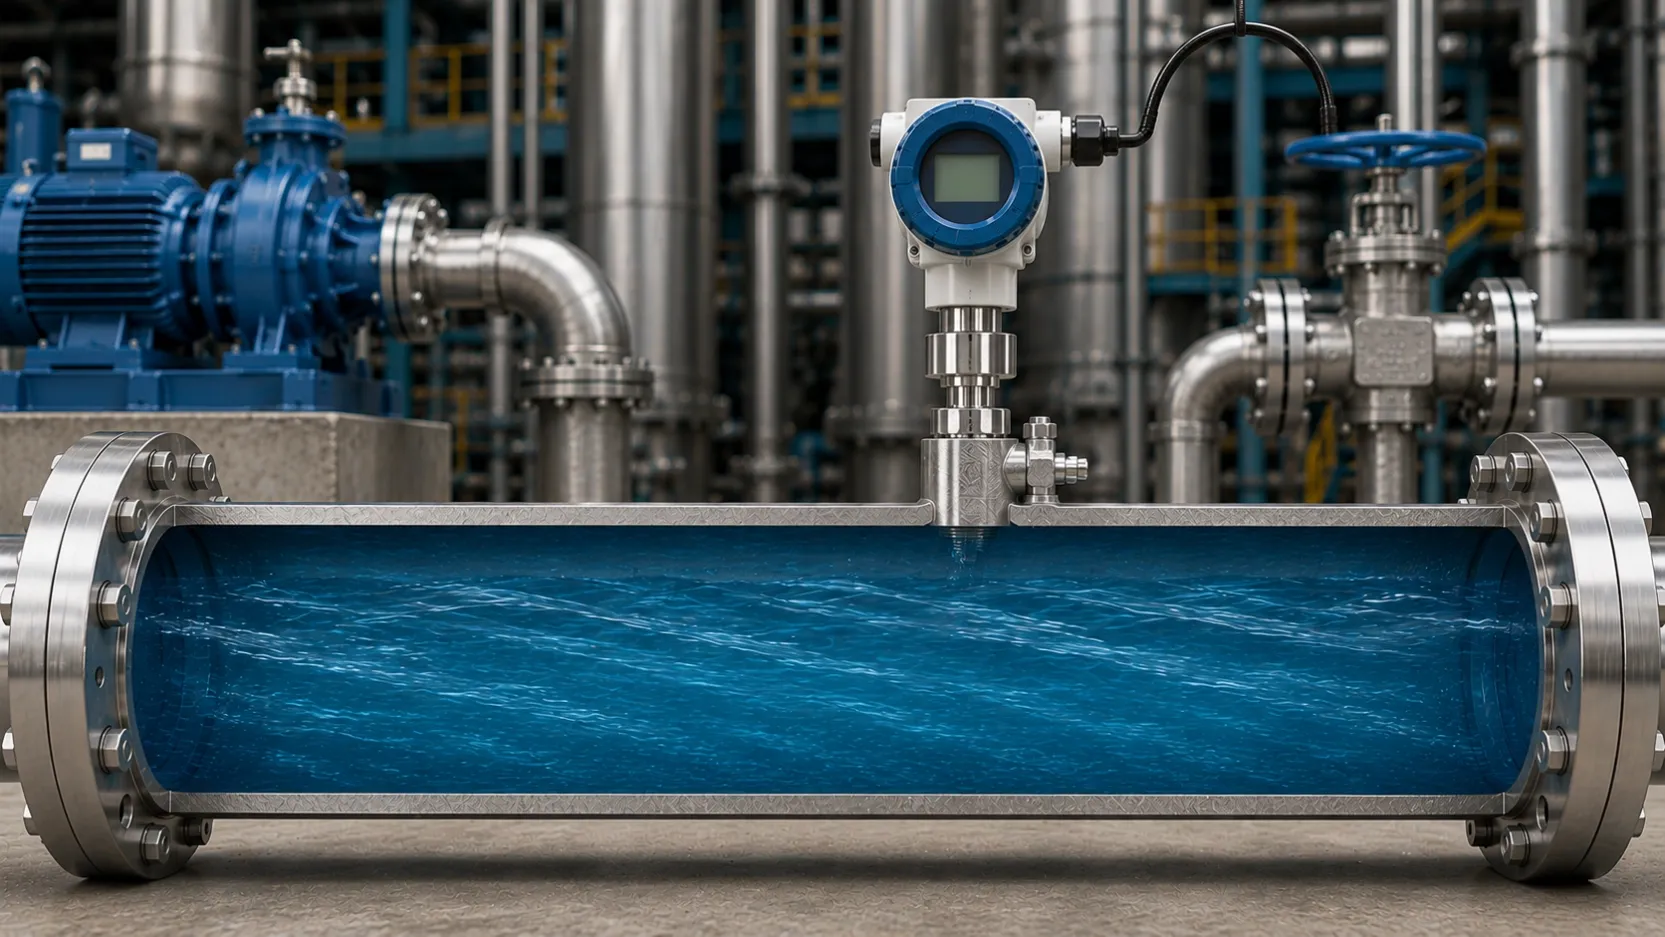
Review pipe size, connection, insertion, orientation, flow velocity, bubbles, solids, coatings, temperature gradients, pressure and cleaning. The sensing location should represent the fluid condition that the control action is intended to manage.
Avoid dead zones or locations where settling, air entrainment or incomplete mixing makes the reading unrepresentative.
Temperature and compensation
Because viscosity can change substantially with temperature, record temperature at a representative point. A compensation model or normalized value should be based on process data and an approved reference, not a universal formula applied without validation.
Correlation with laboratory results
Laboratory and in-line instruments may use different shear conditions and sample handling. Establish a correlation using representative samples and operating conditions. Document the reference method, temperature, sampling time and any model used.
Correlation should be reviewed when formulation, raw materials, process temperature or instrument installation changes.
Maintenance and lifecycle
Moving-part and non-moving-part designs have different maintenance mechanisms. A design without rotating components may avoid some bearings or seals, but buildup, contamination, inspection and verification can still be required.
Lifecycle cost depends on installation, cleaning, calibration or correlation, access, process interruptions and replacement—not the sensing principle alone.
Practical questions
Why do laboratory and in-line readings differ?
They may use different temperature, shear, sample handling and measurement principles. Compare under defined conditions and use an application-specific correlation where needed.
Is a non-moving sensor maintenance free?
No. It may reduce some mechanical wear mechanisms, but the sensing surface, installation and verification still require attention.
Can one instrument measure every high-viscosity product?
No. Range, fluid behavior, temperature, solids, pressure, installation and cleaning must be checked for the exact model.
Which technology has the lowest cost?
There is no universal answer. Compare total installation, commissioning, correlation, maintenance and process-impact costs for the site.
Next step
Provide fluid data, expected viscosity and temperature ranges, process connection, flow conditions, reference method and cleaning requirements. HRT can review available in-line measurement options; final selection should be validated for the process.
Application review checklist
- Fluid behavior, expected viscosity range and temperature variation.
- Installation, flow, process connection and cleaning requirements.
- Required update behavior, output interface and reference method.
Contact our technical team with the operating conditions, installation details and required interface to request an application and configuration review.